2. A primer in urban form
2.1 What urban form is
Urban form, or urban morphology, is the physical shape of a settlement: how its streets, plots, blocks and buildings are arranged. The idea is old. The geographer M. R. G. Conzen, studying Alnwick in 1960, split a town plan into three layers that change at different speeds: the street system (slowest: streets last for centuries), the plot pattern (land ownership parcels) and the buildings (fastest: rebuilt every few decades). The Italian school (Muratori, Caniggia) read building types and how they grow. Space syntax (Hillier and Hanson, 1984) studied how the configuration of streets shapes movement.
Today these ideas are measured. A street network is a graph: junctions are nodes, street segments edges. Buildings are polygons with areas, perimeters and heights. From these come numbers that can be compared between any two places on Earth, and that is what this notebook does. A few words used throughout:
-
Urban fabric: the texture made by streets, blocks and buildings together, as you see it on a map.
-
Block: land surrounded by streets. Grain: fine grain means many small blocks and buildings; coarse grain few large ones.
-
Permeability: how many ways there are through an area on foot. Connectivity: how well streets join up.
-
Density: a quantity per area: buildings, floor space, people, junctions.
Numbers do not replace walking a street. They let you ask sharper questions of it: why is this place more walkable than that one, what changed and when, what is missing. Each measure below comes with how to read it and what it cannot tell you.
2.2 Three street patterns
Most street networks are mixtures of three ideal patterns (Figure 2.1). Keep them in mind: each measure in the next chapters separates them in a different way.
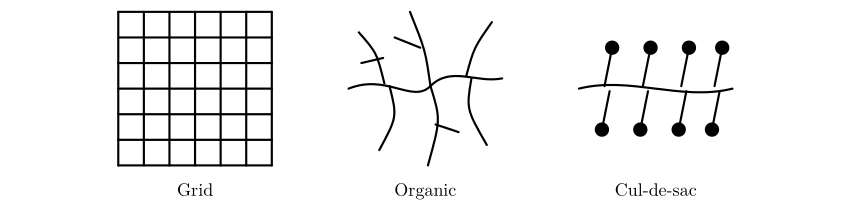
Figure 2.1. Three ideal street patterns. The grid has many four-way junctions, two dominant directions and short, direct routes. The organic pattern, grown over time, has three-way junctions, every direction and moderately direct routes. The cul-de-sac pattern feeds dead ends from a curving distributor road: few junctions and long, indirect routes on foot unless footpaths cut through.
The grid is old: Hippodamus of Miletus planned one in the fifth century BC, Roman camps were grids, and so are Mohenjo-daro, Manhattan and Cerdà’s Barcelona. Organic fabrics grow plot by plot along paths and are typical of pre-modern cores such as Lahore’s Walled City. The cul-de-sac layout belongs to twentieth-century planning that separated cars from homes, as in new towns like Craigavon. None is simply good or bad: grids are legible and easy to walk but can carry through-traffic everywhere; cul-de-sacs are quiet but make short trips long.
2.3 Getting the data
OpenStreetMap (OSM) is a map of the world made by volunteers, free to use under the Open Database Licence. It stores three kinds of element: nodes (points with a latitude and longitude), ways (ordered lists of nodes: streets, building outlines) and relations (groups). Each carries tags, key = value pairs that say what it is: highway=residential, building=yes, building:levels=4, amenity=school. Everything we measure depends on these tags, so their completeness varies by place and must always be checked.
OSMnx asks the Overpass API for the data within a distance of a point and returns a street graph (for walking, network_type="walk", which includes footpaths) and tables of features (buildings, amenities). The graph is projected to a local metric coordinate system (UTM) so that lengths come out in metres.
We download two graphs for each place. The walking graph includes footpaths, and in cities where pavements and crossings are mapped as separate ways it splits every street into many short pieces, so it suits questions about walking (route directness, access) but exaggerates junction counts. The street graph (drive_service: roads and service lanes) describes the layout of streets themselves and is used for structure, orientation and centrality.
SERVERS = ["https://overpass-api.de/api", "https://overpass.private.coffee/api", "https://maps.mail.ru/osm/tools/overpass/api"]


def patient(fn, *args, **kw):
    """Public Overpass servers are shared and sometimes busy: retry with growing waits, trying each server in turn."""
    import time
    for attempt in range(8):
        ox.settings.overpass_url = SERVERS[attempt % len(SERVERS)]
        try:
            return fn(*args, **kw)
        except Exception as e:
            if "No data elements" in str(e):
                raise
            time.sleep(min(60, 5 * 2 ** (attempt // len(SERVERS))))
    raise RuntimeError("Overpass servers busy; run the cell again later")


def fetch(name, latlon):
    G = patient(ox.graph_from_point, latlon, dist=RADIUS, dist_type="bbox", network_type="walk", simplify=True)
    G = ox.project_graph(G)
    tags = {"building": True, "amenity": True, "shop": True, "leisure": ["park", "playground"],
            "public_transport": "platform", "highway": "bus_stop", "railway": ["station", "tram_stop"]}
    F = patient(ox.features_from_point, latlon, tags, dist=RADIUS)
    F = F.to_crs(G.graph["crs"])
    D = ox.project_graph(patient(ox.graph_from_point, latlon, dist=RADIUS, dist_type="bbox", network_type="drive_service"),
                         to_crs=G.graph["crs"])
    return G, F, D


data, drive = {}, {}
for name, latlon in PLACES.items():
    G, F, D = fetch(name, latlon)
    data[name], drive[name] = (G, F), D
    nb = int(F["building"].notna().sum()) if "building" in F else 0
    print(f"{name:22s} walk graph: {G.number_of_nodes():5d} nodes  street graph: {D.number_of_nodes():5d} nodes  "
          f"buildings {nb:5d}  other features {len(F) - nb:4d}")

fig, axes = plt.subplots(1, 4, figsize=(14, 4))
for ax, (name, (G, F)) in zip(axes, data.items()):
    b = F[F["building"].notna()] if "building" in F else F.iloc[:0]
    b[b.geom_type.isin(["Polygon", "MultiPolygon"])].plot(ax=ax, color="#b55", linewidth=0)
    ox.plot_graph(drive[name], ax=ax, node_size=0, edge_color="#333", edge_linewidth=0.5, show=False, close=False, bgcolor="white")
    ax.set_title(name, fontsize=10)
plt.tight_layout(); plt.show()
Belfast centre         walk graph:  2423 nodes  street graph:  1019 nodes  buildings  3317  other features 1424
Barcelona Eixample     walk graph:  2324 nodes  street graph:   315 nodes  buildings  3368  other features 4163
Lahore Walled City     walk graph:  4408 nodes  street graph:  3745 nodes  buildings   471  other features  212
Craigavon (Brownlow)   walk graph:  1571 nodes  street graph:  1020 nodes  buildings   881  other features  418
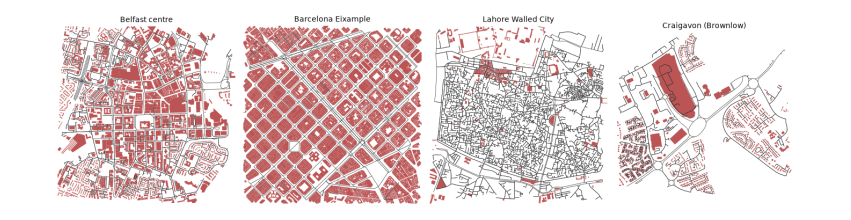
The printout counts what was downloaded for each 1.6 km square. The two graphs differ most in Barcelona: 2,324 nodes for walking but only 315 for streets, because pavements and crossings there are mapped as separate ways. Belfast and Barcelona each have over 3,300 buildings, while the Walled City of Lahore, one of the densest places in South Asia, has only 470. That is not the city; it is the map. Most of Lahore's buildings have not yet been traced in OpenStreetMap, so every building measure for Lahore below is about the mapped part only, a lesson in checking coverage before believing a number. The maps show the street graph in black over mapped buildings in red: Barcelona's grid of square blocks, Belfast's mixture, Lahore's dense mesh of lanes with few buildings drawn, and Craigavon's loops and branches.
The measures in this guide follow published methods: OSMnx for building and measuring networks (Boeing 2017, 2018), street orientation entropy (Boeing 2019), the Spacematrix for density (Berghauser Pont and Haupt 2010), and momepy for building morphometrics (Fleischmann 2019). The layered reading of the town plan goes back to Conzen (1960), and the study of street configuration to Hillier and Hanson (1984).