7. Four harder tests
Everything so far used tidy, ready-made records: one global temperature per year, one for the United States. A fair reader could object that I never went back to the thermometers the study used, that I ignored El Niño, that I treated the global record as if it were known exactly, and that a two-reservoir model is not a climate model. Each objection can be tested, so I tested them. The hands-on guide Climate data in Python walks through every step in code.
7.1 Back to the thermometers
NOAA keeps the monthly records of about 27,000 weather stations in two versions: as reported, and after homogenisation, the correction for station moves, new instruments and changed reading times described earlier under “Old thermometers need correcting”. The station identifiers are the same as in the daily archive the study used, so I could rebuild the study’s own selection (stations that measured daily maximum and minimum from 1900 or earlier to 2020 or later) and find 983 of them with a usable monthly record. For those stations, for all land stations and for the United States, I turned each station’s temperatures into departures from its own 1951–1980 average and combined them in two ways: every station counting once, which is what the study’s method does, and by area, averaging stations inside 5-degree boxes first and weighting each box by its size.
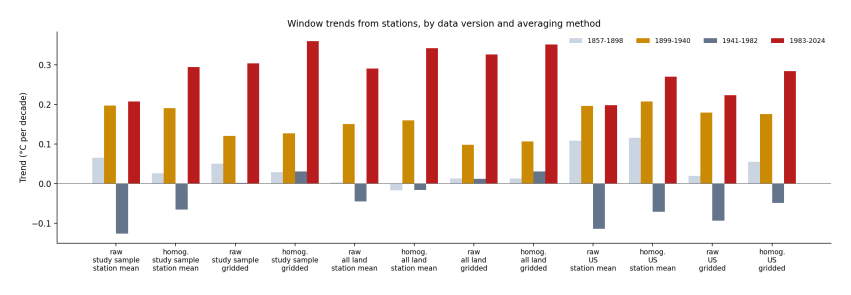
Figure 7.1. Warming rate in each of the paper’s four periods (bars, oldest light grey to newest red), for twelve ways of building the record: raw or corrected (homogenised) data; every station counted equally or weighted by area; and the study’s own stations, all land stations, or the contiguous United States. Data: NOAA GHCN-Monthly version 4.
How to read Figure 7.1. Each group of four bars is one way of building the record. Within a group, the yellow bar is 1899–1940 and the red bar is 1983–2024; the question is which is taller.
The result explains the study’s finding exactly. Take the study’s own stations, uncorrected, every station counted once: the early and recent periods come out almost the same, 0.20 and 0.21 °C per decade. That is close to what the study reported. Now change one thing at a time. Correct the data, and the recent period rises to 0.30. Weight by area instead, and the early period falls to 0.12, because the United States no longer stands in for the world. Do both, as every serious temperature record does, and recent warming is 0.36 °C per decade, nearly three times the early rate of 0.13. The study’s ordering was made by its data choices, not by the climate.
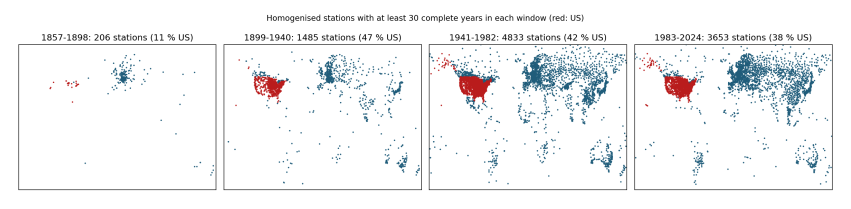
Figure 7.2. Corrected stations with at least 30 complete years in each period. Red: United States; blue: elsewhere.
How to read Figure 7.2. Each dot is a station that has a long record in that period. Before 1940 the long records are almost all in the United States and Europe; most of Africa, South America and Asia is empty. An average that counts stations rather than area is, for those years, an average of the United States.
7.2 El Niño
Every few years the tropical Pacific releases a pulse of heat into the air, an El Niño, and the whole planet is warmer for a year; its opposite, La Niña, cools it. If one period happened to begin in a La Niña and end in an El Niño, its trend would look steeper than the climate’s. I took the standard index of these swings, the sea temperature of the central Pacific since 1854, and removed its share from the global record.
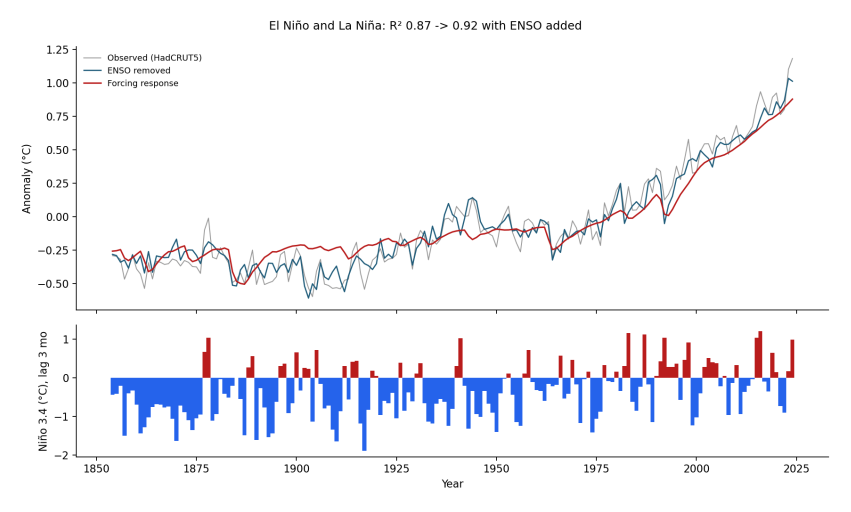
Figure 7.3. Top: global temperature as measured (grey), with El Niño and La Niña removed (blue), and the response of the two-reservoir model to all forcings (red). Bottom: the Niño 3.4 index, three months earlier; red bars El Niño, blue La Niña. Data: HadCRUT5; NOAA ERSSTv5 via KNMI Climate Explorer.
How to read Figure 7.3. The blue line is smoother than the grey one: the spikes of 1878, 1998 and 2016 are gone. Yet the long shape is unchanged. El Niño and La Niña explain part of the year-to-year jitter (the share of the variation explained rises from 87% to 92%), but they shift no period’s trend by more than 0.02 °C per decade. They are noise around the trend, not its cause.
7.3 How sure are the records?
Nobody knows the temperature of 1880 exactly. The Met Office therefore publishes 200 equally likely versions of the global record, which agree where measurements were plentiful and spread where they were thin. I computed every period’s trend on all 200 versions, adding the uncertainty from the unmeasured parts of the globe and the uncertainty of fitting a line.
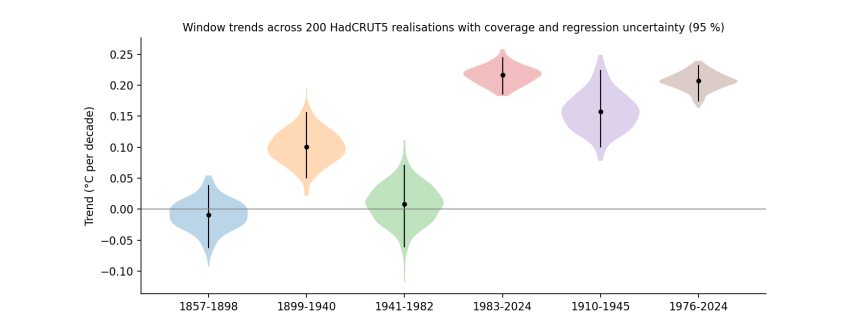
Figure 7.4. The warming rate of each period across 200 versions of the global record (HadCRUT5), including coverage and fitting uncertainty. The width of each shape shows how many results fall at that value; the black line spans 95% of them.
How to read Figure 7.4. The older periods have wider shapes, because the early record is less certain. The early period (1899–1940) lies between 0.05 and 0.16 °C per decade; the recent one (1983–2024) between 0.19 and 0.24. The two ranges do not touch: in all of the 200 versions, the recent period warmed faster.
7.4 What full climate models say
My two-reservoir model is a sketch. Full climate models divide the atmosphere and oceans into boxes about 100 km wide and solve the physics of air, water and heat in each, step by step. Modelling centres around the world run them with the same historical forcing for a shared experiment, CMIP6. Each model also makes its own weather, including its own El Niños at random times, so no single model should match the real wiggles, but together they show what the forcing, plus chance, produces. I read the global temperature of 34 of them straight from their public cloud archive.
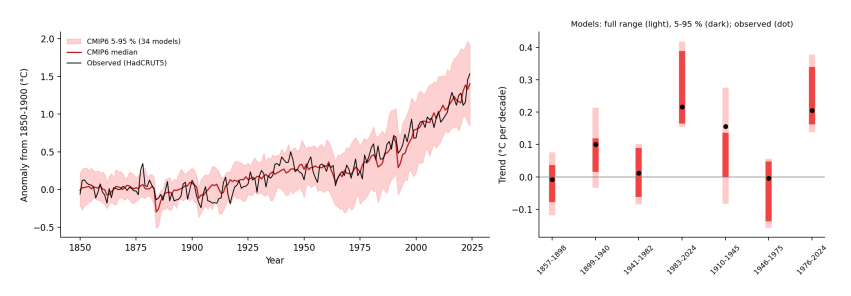
Figure 7.5. Left: global temperature from 34 climate models (red line, middle model; pink band, the middle 90%) and as measured (black, HadCRUT5), relative to 1850–1900. Right: the warming rate of each period in the models (light bar, full range; dark bar, middle 90%) and as measured (black dot). Data: CMIP6 historical and SSP2-4.5 runs via the Pangeo cloud archive.
How to read Figure 7.5. On the left, the black line stays mostly inside the pink band: models given only the forcing reproduce the slow rise to 1940, the flat middle of the century and the steep climb since. On the right, each bar is the spread of the models’ rates for one period, and the dot is what was measured. In all 34 models, 1983–2024 warms faster than any earlier period. The one place the measurements stand out is 1910–1945: the real world warmed faster than 33 of the 34 models. That is the unforced, natural part of the early warming that the previous chapter’s “unexplained” bar showed (Figure 6.2), now seen in full models too.
7.5 Testing the tests
Each of the four tests leaned on a shortcut, so I removed each shortcut in turn.
Daily thermometer readings. The station test used monthly averages. The study used each day’s highest and lowest reading, so I downloaded the daily files for all 1,155 of its stations (2.5 GB) and rebuilt the yearly averages from (highest + lowest)/2, counting a month only if at least 25 days are complete. Station by station, the daily and monthly records give the same trends (United States 0.19 and 0.19 °C per decade for 1983–2024; elsewhere 0.46 and 0.44). Fewer stations outside the US have complete daily years in recent decades (62 in 2024, against 108 in the monthly archive), which is why the area-weighted daily figure for 1983–2024 is lower (0.25 against 0.30).
My own correction. Instead of trusting NOAA’s corrections, I wrote my own: each station is compared with up to ten well-correlated neighbours within 500 km, and a standard test (the standard normal homogeneity test) finds the years where the difference jumps; the earlier part is shifted to match. A typical station has four such jumps. Outside the US my correction and NOAA’s agree closely (0.43 and 0.47 °C per decade for 1983–2024). In the US mine changes almost nothing (0.17 against 0.17 raw) while NOAA’s raises the trend to 0.26. The reason is that US stations changed together—observers moved their reading time from evening to morning, and liquid thermometers were replaced by electronic sensors—and a change shared by all neighbours cannot be seen by comparing neighbours. NOAA corrects these from station records. Berkeley Earth, a fully independent group, gets 0.24 for the US and 0.32 for all land.
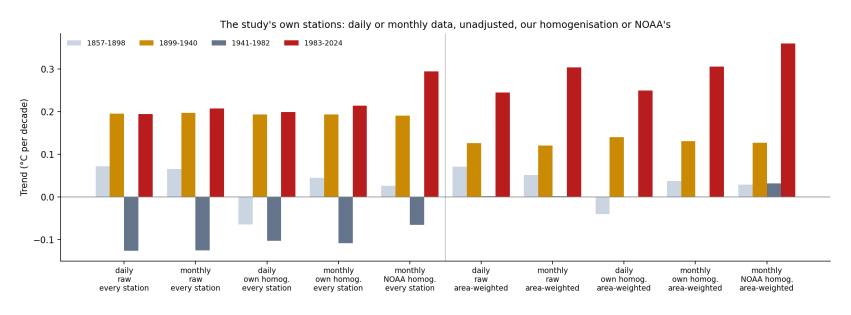
Figure 7.6. Warming rates for the study’s stations from daily and monthly data, raw and corrected (by NOAA and by my own test), counted per station (left) and by area (right).
How to read Figure 7.6. Compare bars of the same colour across the periods. Whatever the data or correction, the area-weighted bars are tallest in 1983–2024; only the per-station counts of uncorrected or neighbour-corrected US-heavy records keep the early and recent periods level.
Different reservoir speeds. The two-reservoir model used fixed response times (4 and 250 years). I reran it 135 times, varying the climate sensitivity (2–4.5 °C per doubling of CO~2~), the share of the fast reservoir and both response times. The greenhouse-gas part of the 1976–2024 trend ranges 0.09–0.37 °C per decade over all versions and 0.19–0.29 in the quarter that fit best; the unexplained part of 1910–1945 stays at 0.10–0.11 in those best versions.
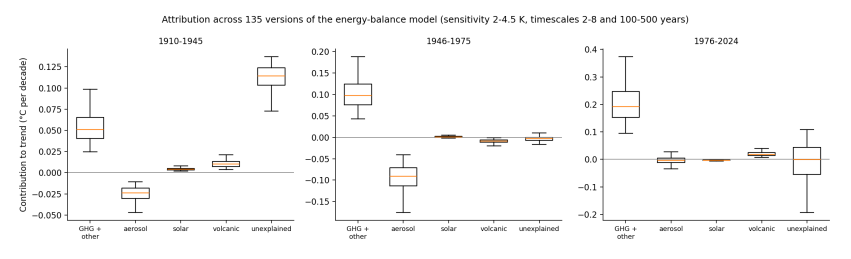
Figure 7.7. Contributions to each period’s trend across 135 versions of the two-reservoir model.
How to read Figure 7.7. Each box shows how far one contribution moves as the model’s settings change. The boxes move, but the order does not: greenhouse gases dominate recent warming in every version.
Many runs of each model. The climate-model test used one run per model. I took up to ten runs each (194 runs from 45 models). Runs of one model differ only by their own random weather. In every one of the 194 runs, 1983–2024 is the fastest period. For 1910–1945, runs of one model spread almost as much as different models do, and four runs (2%, all from one model family) reach the measured rate: the early warming is unusual, but chance can produce it.
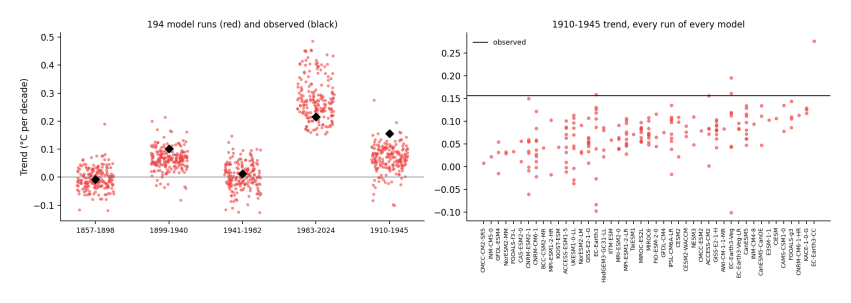
Figure 7.8. Left: warming rate of each period in 194 model runs (red) and as measured (black). Right: the 1910–1945 rate of every run, grouped by model, against the measured rate.
How to read Figure 7.8. On the left, the 1983–2024 cloud sits above all the others. On the right, each column is one model; dots above the black line are runs that warmed as fast as the real world did in 1910–1945.
Choosing the periods. The study’s periods are fixed 42-year blocks. I computed the trend for every start year and every length from 20 to 60 years. For HadCRUT5, the fastest window of every length ends in 2019 or later; for the corrected land stations, in 2007 or later. The fastest 42-year HadCRUT5 trend ending by 1945 is 0.14 °C per decade, against 0.22 for 1983–2024.
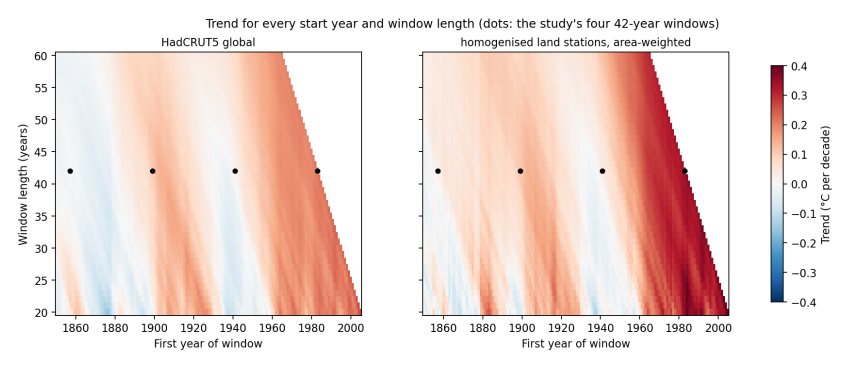
Figure 7.9. Warming rate for every start year (across) and window length (up), HadCRUT5 and corrected land stations. Dots mark the study’s four 42-year periods.
How to read Figure 7.9. Each point of colour is one window; its position gives its start year and length. The darkest reds lie along the sloping right edge, in windows that end in recent years, whatever the length; the study’s 1899–1940 dot sits in a paler band.
7.6 What the tests add
None of the four tests changes the answer of the previous chapters, and one of them explains where the study’s answer came from. Its central result can be reproduced, but only from uncorrected thermometers counted one by one, most of them in one country. Correct the thermometers or count by area, and the recent decades warm fastest; account for El Niño, for the uncertainty of the record, or compare with full climate models, and they still do. Daily readings, an independent correction, other model settings, many runs per model and every choice of period all leave that unchanged.