6. Putting the causes together
If temperature responds to the total forcing from all causes, we should be able to reproduce the temperature record from the forcing alone. Climate scientists do this with full climate models, but a simple version takes a few lines of code. Imagine the climate as two connected reservoirs of heat. The first, the land, air and upper ocean, responds within a few years. The second, the deep ocean, takes centuries. Each year, each reservoir keeps most of last year’s warmth and moves a little towards the level the current forcing would eventually produce. I used standard values for how fast each reservoir responds and how strongly, and fed in each cause’s forcing at its published size, without adjusting anything to fit.
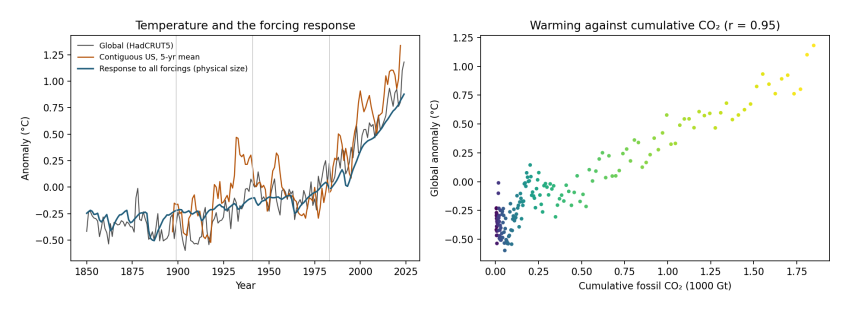
Figure 6.1. Left: global temperature (grey, HadCRUT5), the contiguous United States (orange, five-year average, NOAA) and the temperature produced by the simple two-reservoir model from all forcings at their published size (blue). Vertical lines mark the paper’s windows. Right: the same as Figure 5.1, warming against accumulated fossil CO₂.
How to read Figure 6.1. In the left panel, the blue line is the model and the grey line is what was measured. The model has no knowledge of the measured temperatures except their average level, yet it follows the long rise, the dips after large volcanic eruptions, the flat middle of the century, and the steep climb since the 1970s. It accounts for 87% of the year-to-year variation in global temperature since 1850. The orange US line shows how much more a single region swings about, including the 1930s peak.
The same model lets us split each period’s warming into its causes.
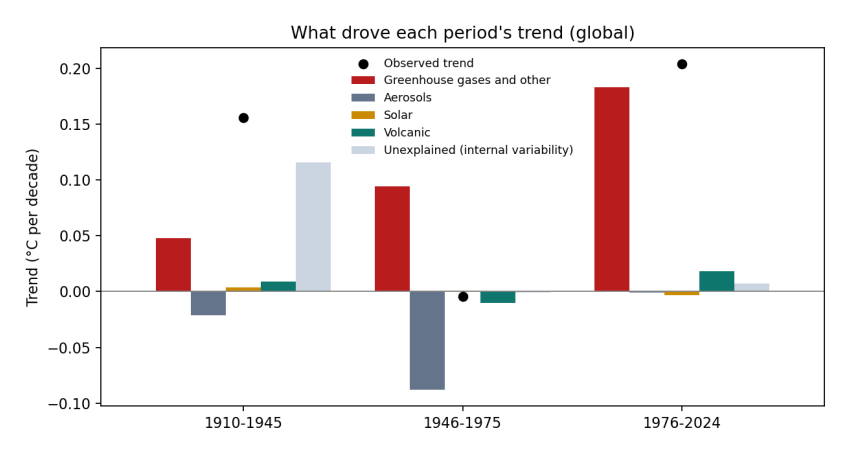
Figure 6.2. The global warming trend in three periods (black dots) and how much of it came from each cause (bars), in °C per decade. Red: greenhouse gases and other human influences; grey: sulfate and other aerosols; yellow: the Sun; green: volcanoes; pale blue: the part the forcing does not explain, which includes natural swings in the oceans and measurement errors.
How to read Figure 6.2. Each group of bars is a period. The height of each bar is how much that cause contributed to the period’s trend: bars above zero warmed, bars below zero cooled. The bars in a group add up to the black dot, which is the observed trend.
Period |
Observed |
Greenhouse gases and other |
Aerosols |
Sun |
Volcanoes |
Unexplained |
|---|---|---|---|---|---|---|
Period |
Observed |
Greenhouse gases and other |
Aerosols |
Sun |
Volcanoes |
Unexplained |
–1945 |
+0.16 |
+0.05 |
−0.02 |
+0.01 |
+0.12 |
|
–1975 |
+0.09 |
−0.09 |
−0.01 |
|||
–2024 |
+0.20 |
+0.18 |
+0.02 |
+0.01 |
Three stories come out of this table. Since the mid-1970s, greenhouse gases account for almost all of the warming; nothing else comes close. In the middle of the century, greenhouse warming of about 0.09 °C per decade was cancelled almost exactly by aerosol cooling of the same size, which is why the temperature line went flat. And in the early twentieth century, the forcing explains only about a quarter of the observed warming. The rest is unexplained by the simple model, and is consistent with what earlier research has concluded: part of that warming came from natural swings in ocean circulation, and part of the apparent jump around 1945 comes from a change in how ships measured sea temperature during the Second World War (Thompson et al. 2008).
That last point is worth dwelling on, because it is where the paper’s observation has something real in it. The early-twentieth-century warming was unusually fast for the forcing at the time, and climate scientists have studied it for decades for exactly that reason. One of the papers the study itself cites, by Gabriele Hegerl and colleagues in 2018 (Hegerl et al. 2018), is a review of it. But a period of natural variability early in the record says nothing against the role of CO₂ in the period since, where the forcing explains almost everything.