4. The same question, asked of better data
I repeated the comparison using records that climate scientists have built specifically to measure change over time:
-
HadCRUT5 (Morice et al. 2021), from the Met Office Hadley Centre and the University of East Anglia, combines land weather stations with sea-surface temperatures measured by ships and buoys. It covers the whole globe, weights each region by its area, corrects known errors in the records, and supplies an uncertainty range for every year.
-
NOAA’s contiguous-US temperature series (NOAA National Centers for Environmental Information 2026) is the official record for the 48 neighbouring US states, also corrected for known errors. I included it because, as we will see, most of the paper’s stations are in the United States.
-
Our World in Data (Our World in Data 2026) provides yearly and accumulated CO₂ emissions.
-
Indicators of Global Climate Change (Forster et al. 2024), an annual update following the methods of the IPCC’s Sixth Assessment Report, provides radiative forcing (explained below) for each cause of climate change from 1750 to 2024.
All four are free to download, and the code I used is short enough to follow line by line. Here is what they say about the paper’s three windows.
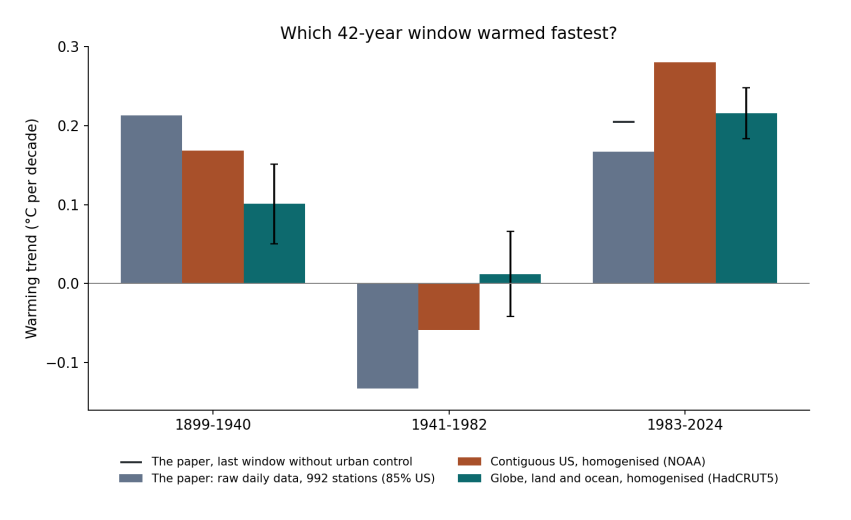
Figure 4.1. Warming trend in each of the paper’s 42-year windows. Grey: the paper’s own results (Table 10), from raw daily data at 992 stations, 85% in the United States; the black dash is its last window without the urban control. Orange: NOAA’s corrected contiguous-US record. Teal: HadCRUT5, the corrected global land and ocean record, with error bars showing the 95% uncertainty of the trend, allowing for the fact that neighbouring years are similar.
How to read Figure 4.1. The three groups along the bottom are the three windows. Within each group, each bar is one dataset, and its height, read on the left-hand scale, is how fast that dataset warmed in that window, in degrees Celsius per decade. Bars above the zero line show warming and bars below it show cooling. The thin black lines on the teal bars show how uncertain each global trend is: if two bars’ ranges overlap a lot, the difference between them could be chance.
The story the figure tells is the reverse of the paper’s. In the corrected global record, the most recent window, 1983–2024, warmed at 0.22 °C per decade, more than twice as fast as 1899–1940 at 0.10 °C per decade, and the uncertainty ranges do not overlap. The middle window did not cool globally; it was close to flat. Even in the corrected record for the United States alone, which is where most of the paper’s stations are, the most recent window warmed fastest: 0.28 °C per decade against 0.17.
Window |
Paper (raw daily, 992 stations) |
Contiguous US (NOAA, corrected) |
Globe (HadCRUT5, corrected) |
|---|---|---|---|
Window |
Paper (raw daily, 992 stations) |
Contiguous US (NOAA, corrected) |
Globe (HadCRUT5, corrected) |
–1940 |
+0.213 |
+0.168 |
+0.101 ± 0.05 |
–1982 |
−0.133 |
−0.059 |
+0.012 ± 0.05 |
–2024 |
+0.167 |
+0.280 |
+0.216 ± 0.03 |
So the paper’s central observation, that warming was fastest in the early twentieth century, does not survive a change of dataset. The interesting question is why, and the answer has five parts. Each one is something that climate science learned, often the hard way, over the past hundred years.