4. Colour
4.1 Match the colour map to the data
| Data | Colour map | Name in carto |
|---|---|---|
| Ordered values, such as snow days | Sequential: one steady change in lightness | SEQUENTIAL (batlow) |
| Values around a meaningful zero, such as anomalies | Diverging: two hues meeting at a neutral colour | DIVERGING (vik) |
| Categories, such as land cover | Qualitative: distinct colours | QUALITATIVE (Okabe-Ito) |
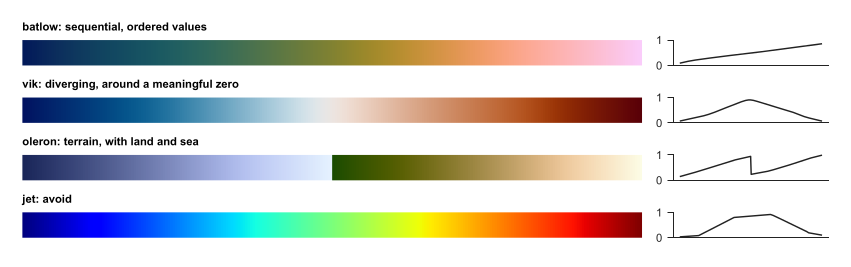
Colour maps (left) with their lightness (right). Batlow rises fairly steadily. Jet rises and falls, creating false edges in smooth data, and fails for many colour-blind readers.

The qualitative palette, chosen to stay distinct for common colour-vision deficiencies.
4.2 Rules
-
Centre a diverging map on the meaningful value, with
vmin=-lim, vmax=lim. -
Fix limits across panels you want compared. Otherwise, the same colour means different values.
-
Stretch by percentiles for display, and say so, because a few bright pixels would otherwise wash out the rest:
lo, hi = np.nanpercentile(a, [2, 98]) -
Never let colour alone carry meaning: add labels or hatching where you can.
-
Print or view in greyscale once, to test the map.
4.3 Over imagery
Satellite images are busy, so plain labels get lost. outlined() adds a dark edge to text, and mark() draws numbered white circles, which read on any background. Explain the numbers in the caption or a table. This also suits print, since long place names no longer cover the data. From the code: research_helpers/carto.py, mark(), lines 102--107
def mark(ax, points, transform=None, size=7):
    """Numbered markers with a halo, readable over any image. points is a list of (number, x, y); a caption or key explains them."""
    transform = transform or ccrs.PlateCarree()
    for n, x, y in points:
        ax.text(x, y, str(n), transform=transform, ha="center", va="center", fontsize=size, fontweight="bold", color="black", zorder=20,
                bbox=dict(boxstyle="circle,pad=0.25", facecolor="white", edgecolor="black", linewidth=0.5))
From the code: research_helpers/carto.py, outlined(), lines 110--112
def outlined(ax, x, y, text, transform=None, size=7, color="white"):
    """A place label with an outline, for use over imagery."""
    return ax.text(x, y, text, transform=transform or ccrs.PlateCarree(), fontsize=size, color=color, zorder=19, path_effects=[pe.withStroke(linewidth=1.8, foreground="black")])